



Dec 12, 2025
Tips For Conducting Studie
Financial Loan Performance & Risk Analysis Dashboard
This project delivers a comprehensive business intelligence solution for analyzing loan portfolio performance, customer repayment behavior, and financial risk using Microsoft Power BI. The objective was to transform raw transactional loan data into meaningful insights that enable financial institutions to improve lending decisions, reduce default risk, and optimize portfolio performance.
The solution involved extensive data preparation using Power Query, including data cleaning, transformation, feature engineering, dimensional modeling, and star schema implementation to improve analytical performance. Custom DAX measures and calculated columns were developed to evaluate key performance indicators such as total loans, loan values, default rates, repayment performance, customer segmentation, and profitability.
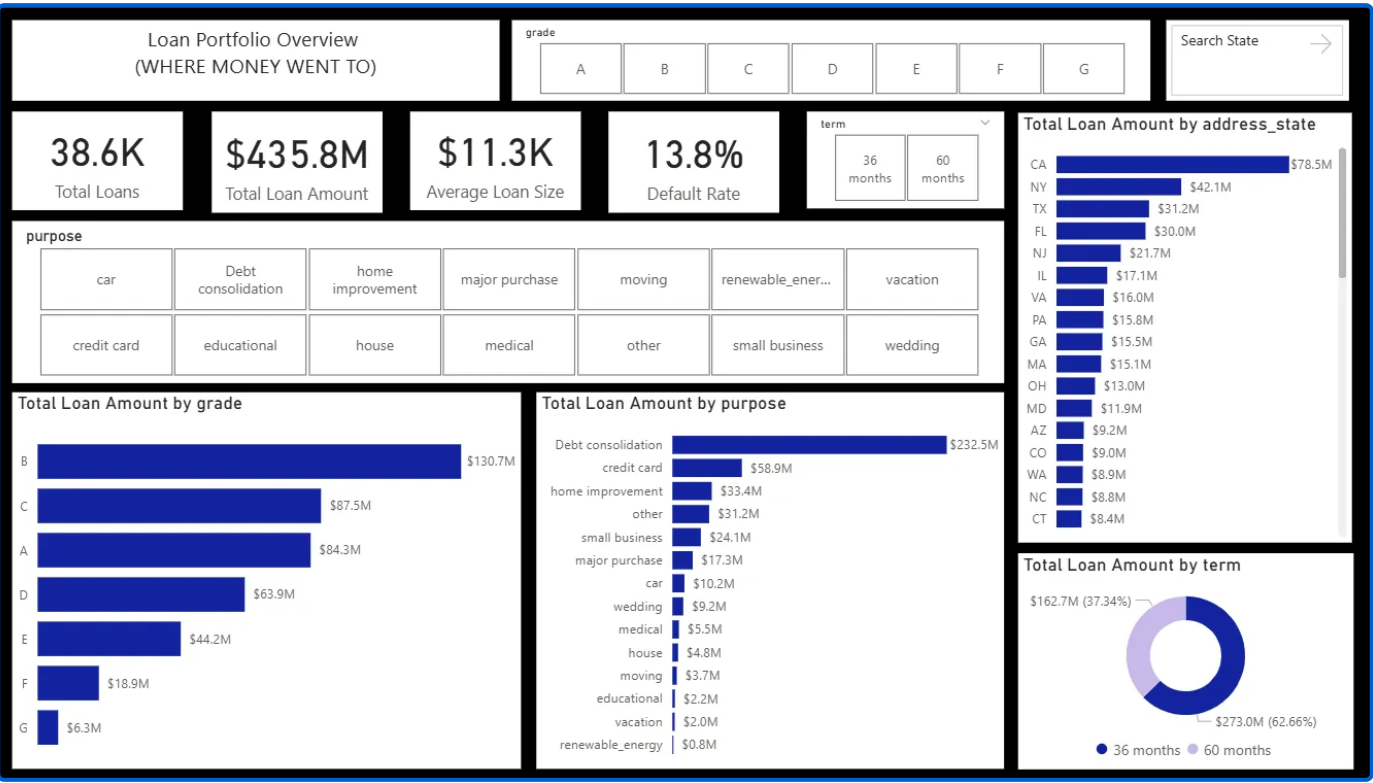
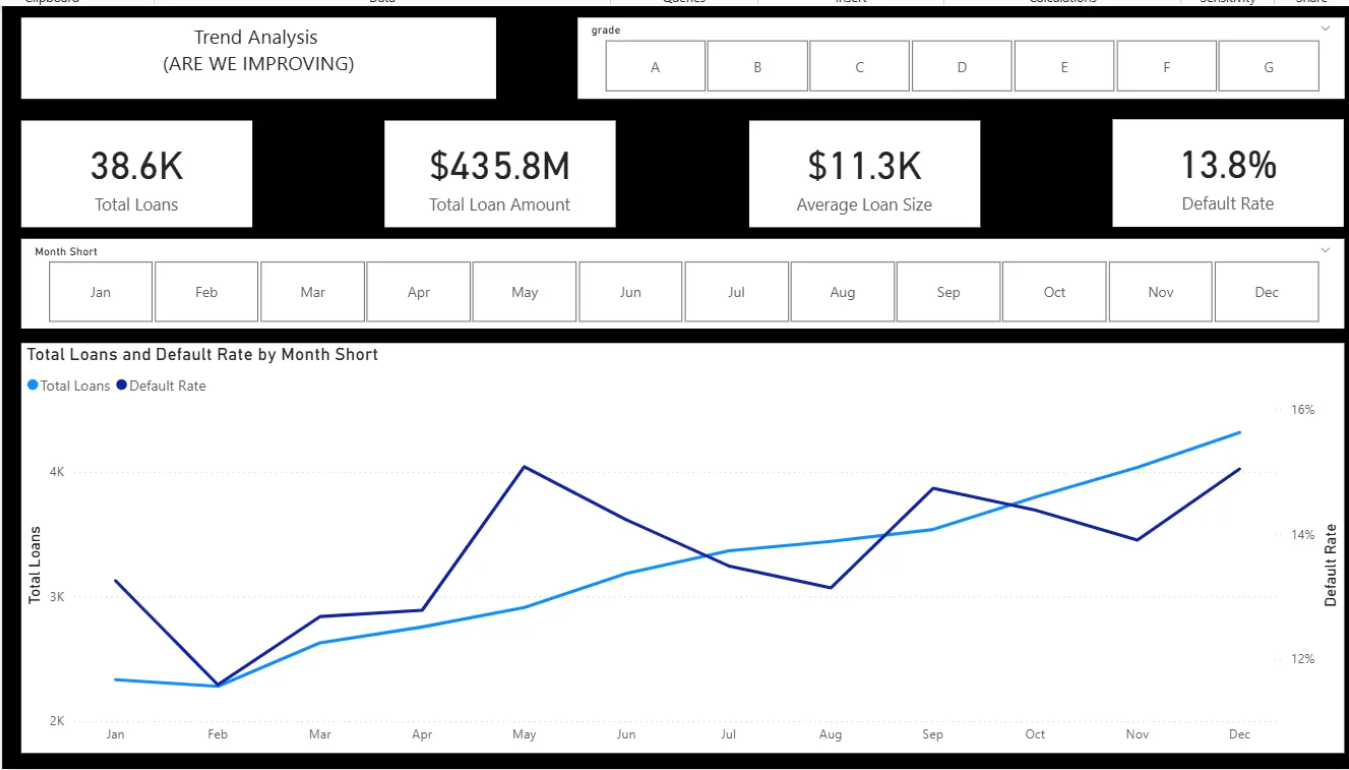
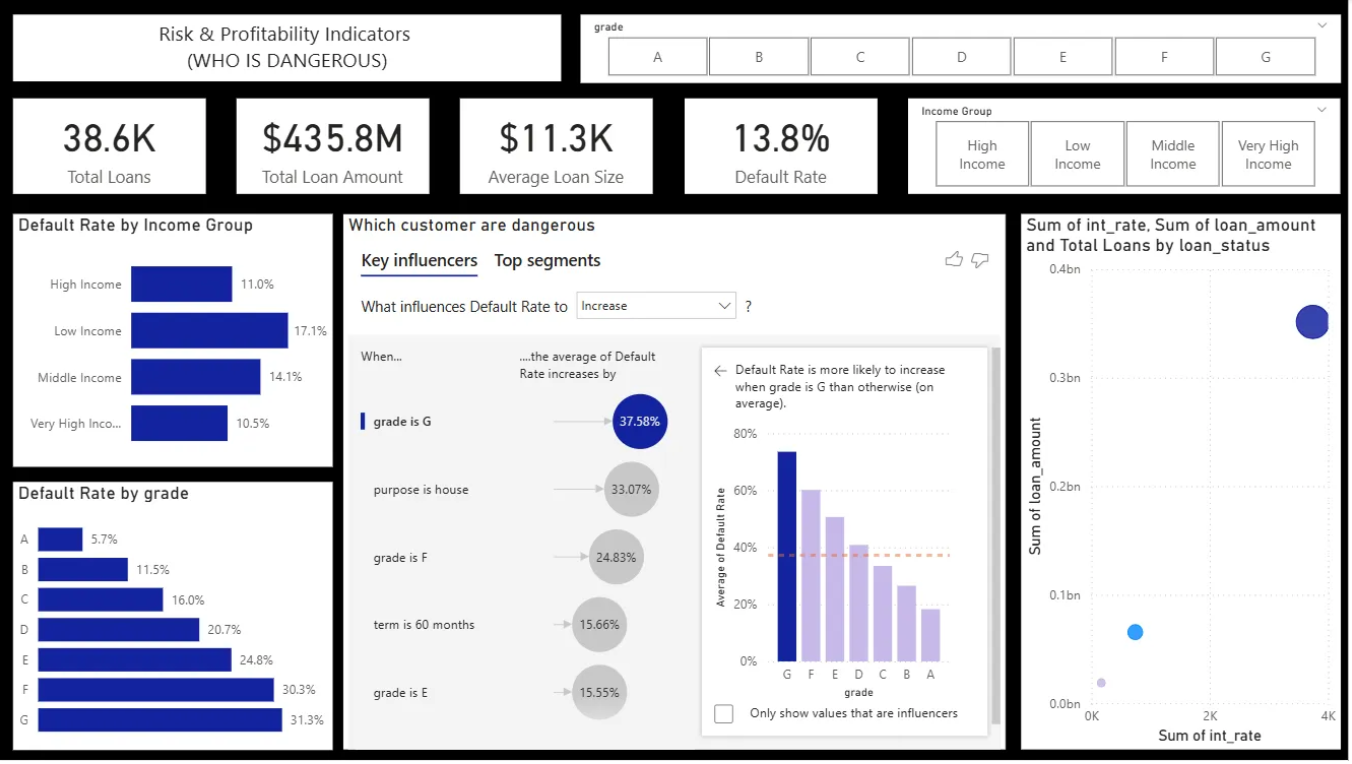
An interactive dashboard was designed to provide executives with real-time visibility into loan performance across multiple dimensions, including customer income levels, employment stability, credit grades, loan terms, geographic distribution, and repayment trends. Advanced visualizations, including KPI cards, trend analysis, scatter plots, and Key Influencers, help identify the primary drivers of loan defaults and support evidence-based lending strategies.
Power BI
Business Intelligence
Data Analytics
Financial Analytics
Risk Analysis
Dashboard Development
Data Visualization
DAX
Power Query
Financial Reporting
Service
Business Intelligence
Location
Global
Published
July 13, 2026
The Challenge
The agricultural export dataset contained inconsistent formatting, unstructured date fields, and missing standardization that limited meaningful analysis. Export performance was spread across multiple products, companies, ports, and time periods, making it difficult to identify profitability trends and operational inefficiencies. Additionally, stakeholders lacked a centralized reporting solution to monitor export performance and support strategic decision-making.
Our Solution
A comprehensive data transformation process was implemented using Microsoft Excel to clean, standardize, and prepare the dataset for analysis. New analytical features such as export months and seasonal classifications were created to enable deeper trend analysis. An interactive dashboard was then developed to visualize product profitability, company performance, export port efficiency, seasonal trends, and cost effectiveness, providing decision-makers with actionable insights for improving profitability and operational efficiency.
Technologies Used
Microsoft Excel
Pivot Tables
Pivot Charts
Power Query
Advanced Excel Functions
Data Cleaning & Transformation
Key Features
- Interactive executive dashboard
- Export company performance tracking
- Quarterly and seasonal trend analysis
- Export port efficiency analysis
- Cost versus revenue comparison
Project Gallery
Project Summary
The Financial Loan Performance & Risk Analysis Dashboard transforms complex financial data into an actionable decision-support system for lending institutions. By combining robust data modeling, statistical reasoning, and interactive business intelligence dashboards, the solution enables stakeholders to identify high-risk customer segments, optimize credit policies, monitor portfolio health, and make more informed lending decisions. The project demonstrates how modern data analytics can improve operational efficiency, reduce financial risk, and drive strategic decision-making.

